Location: Sainsbury Laboratory Cambridge University (map)
Dates:
Instructors: Sandra Cortijo, Hugo Tavares, Anna Gogleva
Requirements: participants must bring a laptop with a few specific software packages installed beforehand (details below).
Description
This is a series of short and modular workshops where you will learn how to analyse data using the statistical software R. Each module will be 1h30m - 2h long and we will cover topics such as:
- How to prepare your data to maximise the number of questions you can ask from it
- How to visualise data
- How to filter and summarise your data efficiently
We specifically focus on tabular data (like you would produce in a spreadsheet) and aim to very quickly teach you how to produce high-quality graphs to enable efficiently data exploration.
No prior knowledge of R is assumed. Even if you already know R, this might
be useful if you want to refresh your memory or learn about specific packages
that we will cover (ggplot2 for plotting and dplyr for manipulating tables).
As an example dataset we will be using real data published by Burghardt .. Schmitt (2015).
Course Materials
Module 1
Intro to R and read your data into R
Module 2
Data visualisation (exercise solutions)
Module 3
Module 4
Further resources
The University runs several introduction courses on R and other topics (bioinformatics, image analysis, etc.):
- Full course list
- Intro to statistics (using R): https://www.training.cam.ac.uk/event/2235484
Software installation
You will need a laptop with the following software installed:
In each case, download the relevant installer for your operating system (Mac, Windows and Linux versions are available) and install the programs as you would do normally.
After installing both of those programs, we would ask you to install some R packages (these are like “extensions” to add extra functionality to R):
- Make sure you’re connected to the internet
- Open RStudio
- In the top menu choose
Tools > Install Packages... - Type the following in the “Packages” box:
tidyverse,visdat,plotly - Click “Install” and the installation should happen automatically
Please confirm that the packages are properly installed by doing the following:
- Open RStudio
- In the “Console” panel (bottom left) type the following commands, one at a
time:
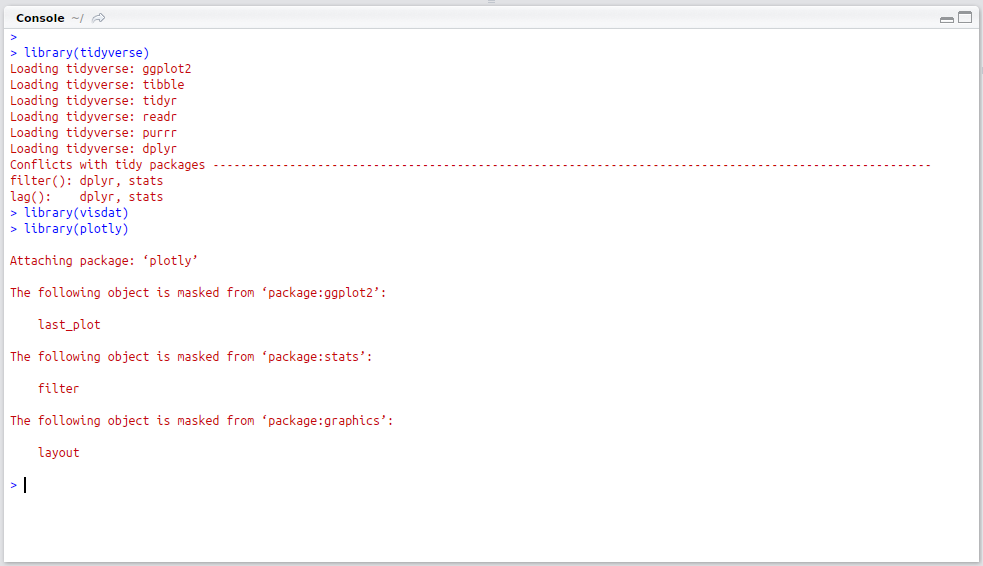
library(tidyverse)library(visdat)library(plotly)
- The output should be similar to what is shown in the screenshot below. If you get a message, such as: “Error in library(tidyverse): there is no package called ‘tidyverse’” please get in touch with one of the instructors before the course.